- Farm Management
- Software
- Measurement software
- Pinova ltd.
- Company
- Products
- Catalogs
- News & Trends
- Exhibitions
Management software PinovaSoftmeasurementagricultural
Add to favorites
Compare this product
fo_shop_gate_exact_title
Characteristics
- Function
- management, measurement
- Applications
- agricultural
Description
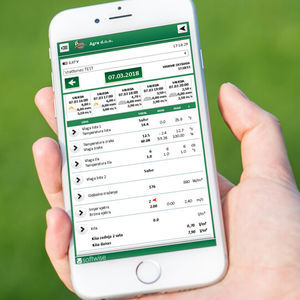
The PinovaSoft application facilitates seamless communication between the sensors of the Pinova Weather Station and your computer. Each time you launch the PinovaSoft application on your computer, the most recent measured data is displayed in a highly intuitive graphical or tabular format.
What sets PinovaSoft apart from its competitors is the clarity of data presentation and the speed at which desired information can be accessed for various time periods. The application is designed for the transfer and processing of measured parameters, making it exceptionally easy to install and use. With just one click, you can calculate and display the average, minimum, and maximum values of the measured parameters within a selected time period.
In addition to the standard time intervals of 10 minutes, 2 hours, 6 hours, 1 day, 1 week, and 1 month, users can adjust the display for other periods (e.g., 10–50 minutes in 10-minute increments, 1–23 hours in 1-hour increments, 1–31 days in 1-day increments, 1 or 2 weeks, and 1–12 months in 1-month increments).
In report form, the application allows the review of the dew point in 10-minute intervals and evapotranspiration in a daily view.
PinovaSoft application enables:
Graphical or tabular viewing and printing of all data measured by the Pinova Weather Station in real time.
Automatic calculation and graphical or tabular review of minimum, average, maximum, and/or cumulative data values across different time resolutions.
Calculation of disease development forecasts for specific crops.
Calculation of dew point and evapotranspiration.
Calculation of temperature sums using the degree-hour or degree-day algorithm.
Catalogs
*Prices are pre-tax. They exclude delivery charges and customs duties and do not include additional charges for installation or activation options. Prices are indicative only and may vary by country, with changes to the cost of raw materials and exchange rates.


